RI Redistricting: Providence City Council
The Providence City Council is just starting to undertake the process of redrawing the city’s 15 wards with 2020 census information. City Council redistricting is even less high-stakes than General Assembly redistricting, for the simple reason of the one-party dominance within the city. All 15 seats are held easily by Democrats, and much like many of the uncompetitive Assembly districts, the bigger intrigue re: redistricting is where primary challengers are drawn in relation to their intended opponent.
As with all my redistricting content, I pay no consideration to the residence of any candidate, incumbent or not. Instead, I focus on drawing compact districts that provide proper representation to the city’s neighborhoods. Obviously, while there won’t be much analysis to provide regarding the electoral outcomes in my hypothetical districts, the relative margins do reveal some trends about Providence’s political geography that are interesting but nevertheless undiscussed.
To start, below is a map showing the boundaries of Providence’s 25 neighborhoods. With 15 City Council wards, and differing populations across the neighborhoods, it is challenging but not unreasonable to expect that wards should be drawn without excessively splitting up neighborhoods. Additionally, I keep population deviation as low as I can, in this case it is 1.7%.

Therefore, my proposed map is as follows:

Aside from some overlap that is just unavoidable, I keep neighborhoods whole, as broken down below. If a neighborhood is split, I try my hardest to keep it in just two districts.
Ward 1: Fox Point, Wayland
Ward 2: College Hill, Downtown
Ward 3: Blackstone, Hope, Mt. Hope
Ward 4: Charles, Smith Hill
Ward 5: Wanskuck
Ward 6: Elmhurst
Ward 7: Mt. Pleasant, Manton
Ward 8: Valley
Ward 9: Federal Hill
Ward 10: Hartford, Olneyville
Ward 11: Silver Lake
Ward 12: West End
Ward 13: Washington Park, South Elmwood, Reservoir
Ward 14: Elmwood
Ward 15: Lower South Providence, Upper South Providence
The map, I think, is pretty successful in its treatments of neighborhood and other major borders. The ward I am probably least happy with #12, which jumps from the West End over Route 10 into Silver Lake, although the district is still connected by driving via Union Avenue. In general, this area (Silver Lake, West End, Hartford, Olneyville) is tough because it is the densest, and fastest growing, area of this city. Ward 10 makes a jump over Route 6 as well, but it does so while covering the entire Olneyville neighborhood.
The most interesting part of this exercise is to look at the results of the past 2 presidential election in these proposed wards. Although, as I said, there are no competitive (in a General Election) wards in this overwhelmingly Democratic city, the results do reveal some interesting trends about the political coalitions in the country at large.
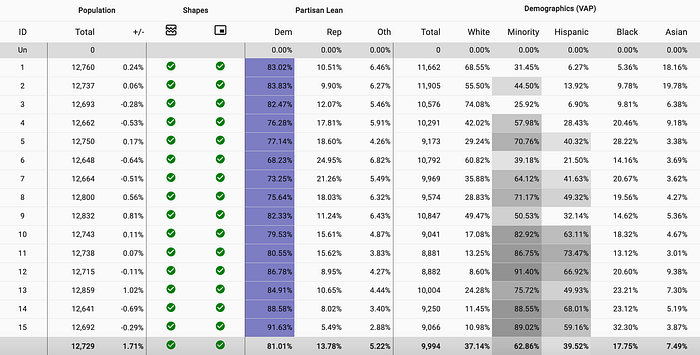
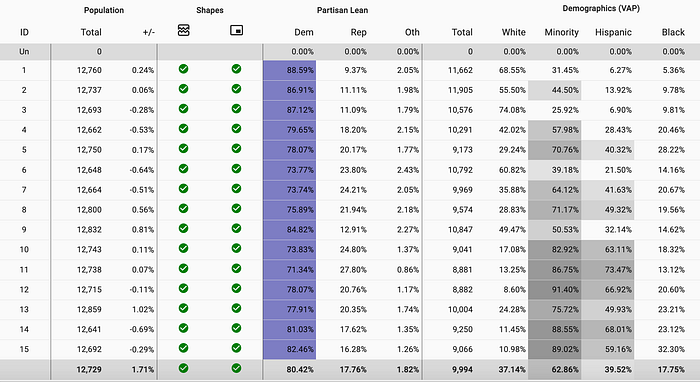
In 2016, Hillary Clinton won Providence by 67 percentage points. Clinton received 70+% in 14 of the proposed wards, 80+% in 9 wards, and 90+% in 1 ward. Ward 6 in 2016 was the best ward for Trump in either election, as he reached 25 percent there. Conversely, Ward 15 in 2016 was the most Democratic Ward in either election, hitting 92% for Clinton. In 2020, Biden won Providence by 62 percentage points. He hit 70+% in every ward and 80+% in six wards.
As I have written about before, Providence was one of 2 municipalities (the other being Central Falls) in Rhode Island to swing towards Trump in 2020. These cities have the highest Latino populations in the state, and it was a huge swing among these voters (a trend that was observed uniformly across the nation) that moved these cities toward Trump in 2020. Looking at the Wards I have drawn here, you can see this quite clearly. In fact, the percentage of minority voters in a Ward was an almost perfect predictor of how it swung from 2016 to 2020.
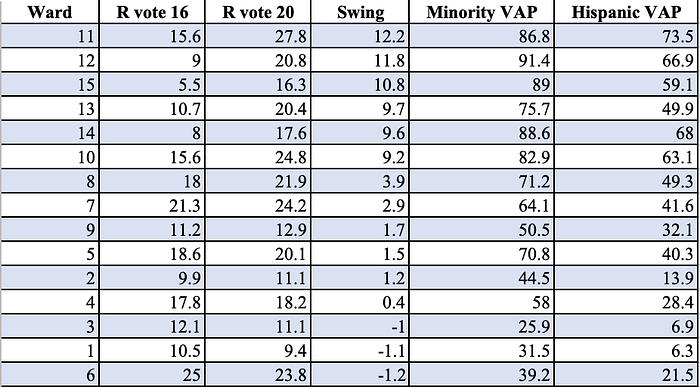
The 3 proposed wards with the largest swings in Republican vote share, all over 10 percentage points, have 85% or more in minority voting age population. The other wards with greater than 80% Minority VAP swung by over 9 points. The only outlier is Ward 13, which swung a further right than you might predict based on demographics. On the other end, the only districts to move left were the three with the lowest minority VAP by far. In the case of Wards 1 and 3, you’re also looking at the wealthiest areas of the city on the East Side. Providence, like many cities, is increasingly polarizing around income and education, such that the most liberal areas are the wealthiest, whitest, and most educated, while the diverse, working-class areas of the city are moving to the right.
So what does all this mean? For the City Council elections, likely nothing. It’s rare that these elections are competitive, and the action happens in the primary only. But for the other major elections — both primary and general elections — in Rhode Island this year, including the race for the 2nd Congressional District, Governor, and Mayor of Providence, candidates would be foolish to ignore the political-geographic-demographic trends at work here.
